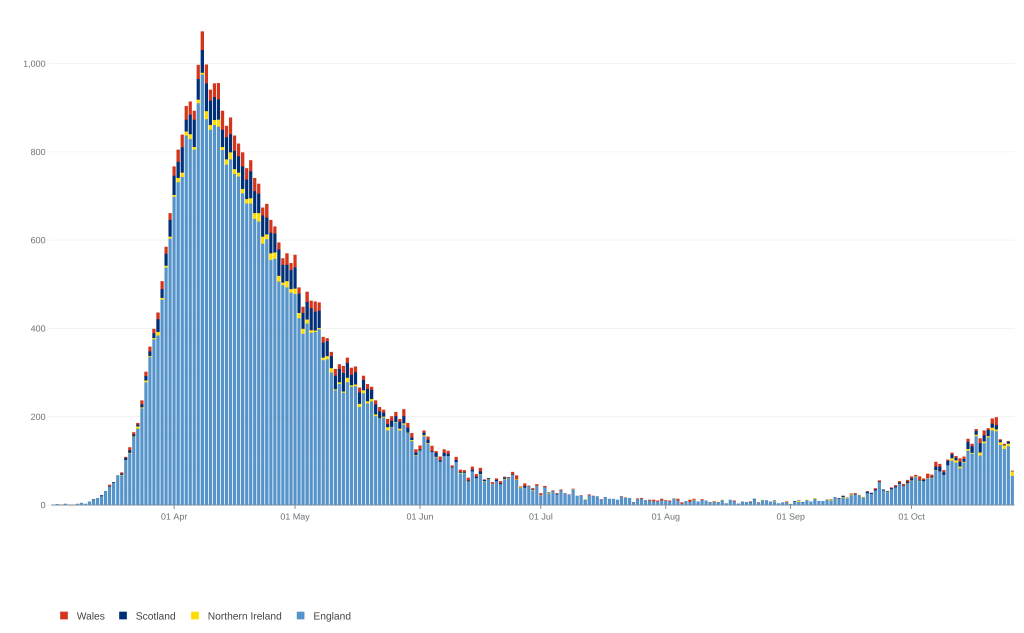
Well, that august scientific advisory body, SAGE, has produced yet another projection for a forthcoming second wave, courtesy (again) of Imperial College Modelling, inc. It’s all about death, this time. It appears on all the front pages today:

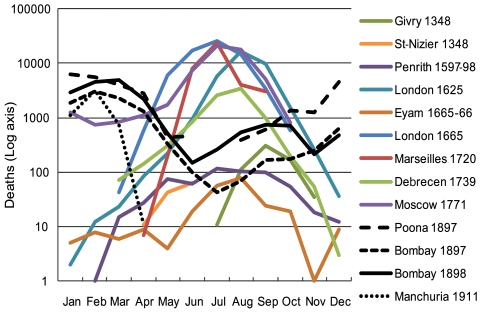
Now, there are one or two things to note about this. The first is to compare it to the actual data, which show a seasonal rise in COVID “cases” (rightly or wrongly diagnosed) well in line with annual averages (see chart lower right and below). There are signs that, following comparable European countries, it is leveling off.
The model takes account of this, but at some time near in the future, for inexplicable reasons the flattening shape of the graph suddenly changes to an exponential rise which, unlike any epidemic ever in history, then flattens off at a maximal death rate permanently. Nobody gets immunity, apparently, and there isn’t even a decrease because of de-population, though maybe that’s what is implied at the end, which looks to be around spring 2022.
Do you believe that? One reason for not doing so is that SAGE now has a track record of drawing future projections that bear no obvious relation to current trends. The first was the totally exaggerated Ferguson models back in March (not peer-reviewed even now). We know from Sweden, in particular, just how fit they were.
The second was the claim by Messrs Vallance and Whittey in September that cases would likely double weekly until by Mid October 200 would be dying each day, and exponentially more thereafter. In fact it was half that number, and the increase has been the usual autumn linear one, and still shows ZERO excess deaths nationally. SAGE is always predicting catastrophe just around the corner, and never reporting it from data.
The second thing to note is that this projection for a second wave is entirely different in shape from the one produced in September, or indeed anything we’ve seen so far. If, per impossibile, it turned out to be accurate, then it would prove that SAGE has been wrong in every other prediction it has made, and got it right this time by luck.
Maybe they’ve factored in the Big Gloom headline yesterday that circulating antibodies decrease quite quickly and ergo nobody ever gets immune. As several proper doctors pointed out yesterday, this is what always happens with Coronavirus, and it doesn’t stop immunity lasting several years, because of B cells, T cells, and all that basic immunology which is getting ignored by the mainstream. The research was also known weeks ago, and was clearly puffed in the headlines yesterday to meet some agenda… oh coincidence! SAGE is calling for national lockdown today! Those behavioural psychologists at SAGE have clearly been busy again.
Be that as it may, let me turn aside to another fundamental issue. I don’t know about your country, but in the UK, the big aim of all this destructive policy is to “get the R number below 1.” If this doesn’t happen, COVID is “out of control.” You’ll know that the “R number,” whilst actually calculated by esoteric proxies of dubious accuracy, is inherently simply: if a sufferer infects less than one person on average, a disease decreases. Infect more than one, and it increases.
But this is autumn, and everybody knows that the usual respiratory viruses, from colds to flu, are on the increase as reliably as leaves and temperatures are on the decrease. 20% of winter colds are due to one of several Coronaviruses, and I’ve already had the first of mine (despite all those COVID restrictions). I will usually get one or two more before winter is out. We all will, unless we’re very lucky.
Now tell me this, then. Is the current R number for cold and flu viruses less than 1, or more than 1? And within that, are the Coronavirus R numbers less or more than 1? And is not SARS-CoV-2 a Coronavirus too? So will its R number be less or more than 1 at this time of year, in the nature of things?
Any general lockdown measure that succeeds in reducing the R number of COVID will also reduce it for all the other viruses of winter, and they will all disappear to the same extent. We will have a cold- and flu-free winter. How probable is that, do you suppose?