
Boris Johnson, in the recent parliamentary debate on Tier restrictions, laid great emphasis on the need to “control this virus” (once again reference was made to the non-existent “sole alternative” of “letting it rip,” further diminishing the credibility of the government’s assessment of evidence). The next day, rebel Conservative and former leader Sir Iain Duncan-Smith defended his position by saying that lower Tiers had proved sufficient to “control the virus.” It is rare to find anyone question whether the virus has ever been under control at all. But it is the key question.
A useful graphic, from an excellent discussion by Ivor Cummins and others, demonstrates clearly that nothing that has been done – with one possible exception – has affected the British course of COVID-19 at all. I should add here that the situation is the same in most other places, except where islands such as Taiwan or New Zealand shut down severely and early. The announcement today of new spikes in the Channel Islands suggests such successes can only be temporary.
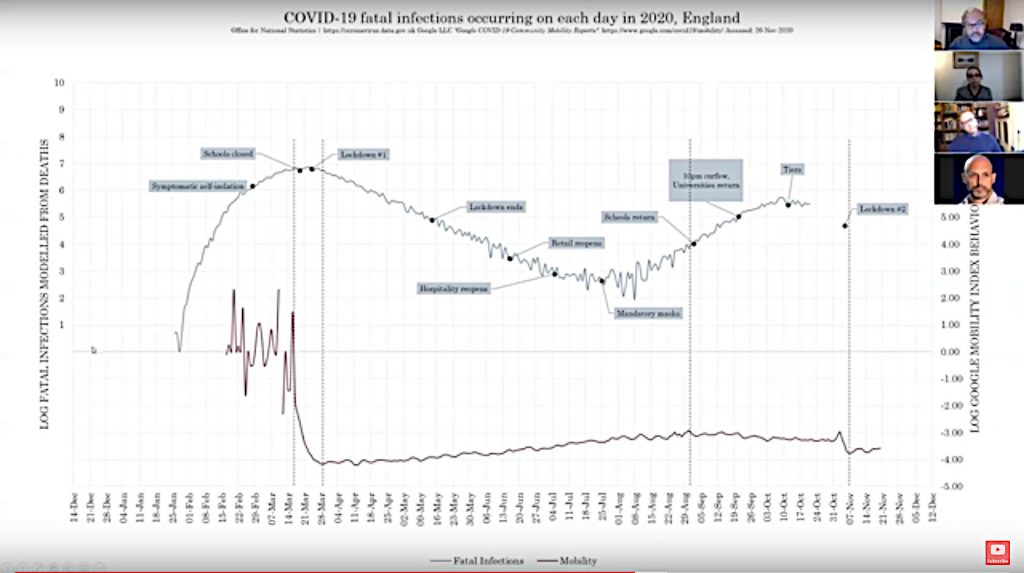
This chart shows deaths attributed to COVID-19 on a log scale (with adjustment of their date to approximate the onset of the fatal infection). This enables changes in the rate of infection to be seen clearly: an exponential change becomes a straight line, and everything less a curve.
The lower trace is the log of a mobility index based on Google’s tracking of mobile phones (they always know where you are!), and hence broadly shows people’s avoidance or otherwise of social contact and/or their compliance with restrictions on movement. This is actually more informative on a linear scale, but it will serve us OK here.
If we move from left to right, the first significant point is that the “Gompertz curve” of the initial epidemic, which should be exponential at the beginning and therefore straight, is shown to curve from the onset. If you like, the virus was working against resistnace from the beginning of February. This is a clear indication that the modelling of Imperial College, which assumed zero immunity to a new virus, was flat wrong, and hence their estimates of death were never realistic. There are probably two main reasons for this.
The first is the existence of natural immunity to COVID and, more importantly, a considerable amount of T-cell cross-immunity to other Coronaviruses. The second reason is that the virus, as was confirmed by research in the news only yesterday, had already been in the country since November or December unsuspected, and was therefore spreading freely for two or three months. Given the high rate of asymptomatic and mild infections with SARS-CoV-2, any deaths would have been buried in the rather low winter infections data.
Next up is the smooth curve running to the peak in the week of 21st March. This represents further gains in immunity and the diminution of individuals vulnerable to death, that is to say, it follows the natural path of all epidemics. What is important is that the slope of this curve is not in the least affected by the advice for symptomatic people to self-isolate in the last week of February, by the closure of schools and the advice to socially-distance towards the end of March, and finally by the imposition of lockdown on March 23rd. None of these change the death rate one iota.
Lockdown began a few days after the peak of fatal infections, but since the time from any measure to affect the infection rate is accepted as around two weeks, it is plain to see that the rate had been decreasing for well over a fortnight before lockdown. Neither voluntary nor compulsory measures had any effect whatsoever on “controlling the virus.”
The next segment of the curve is a slowly decreasing straight line until the end of July, and that tells us there was a natural, exponential, decay in infections. The determining slope of this straight line, notice, begins at the start of lockdown, ie a fortnight before the latter can have been a cause. Lockdown affects it not even by one degree. This is despite the fact that the mobility trace at the bottom shows that, initially, lockdown was highly effective in reducing public mobility – yet it did not affect the number of infections.
The steady, natural, decline in fatal infections was also completely unaffected by the cessation of lockdown at the beginning of May, the re-opening of shops in mid-June, or the re-opening of the hospitality sector in early July, the exponential curve ending suddenly five weeks after the last of these.
Note that people’s mobility (aka “lack of compliance”) increases steadily throughout the decline in infections, regardless of state impositions. This increase is far more obvious in the linear trace, and demonstrates conclusively, against the claims that public misbehaviour is the cause of spread, that the more the public ignored the restrictions, the lower infections became. This is not, obviously, causal, except that the natural decline of an epidemic occurs because more people get it and become immune.
The exponential decline ends in the second week of August, after which there is a much less steep increase in positive cases than in March, exhibiting a slight downward curve throughout until it peaks in the second week of October. Clearly this cannot be due to carousing holiday-makers, since the busy holiday season began months earlier as deaths continued to fall. In Devon, track and trace was unable to attribute a single death to the holiday traffic. It may, perhaps, reflect the very earliest signs of the winter infection season, which becomes noticeable on a linear scale around 20th September, the usual time.
But bear in mind that the death rate in August was very low, and that PCR testing was increasing rapidly, so many of these fatal infections are likely to have been false COVID positives dying from other causes (remember that the UK definition of “COVID death” requires no clinical diagnosis, but only death within 28 days of a PCR test).
Nevertheless, as Cummins and Co. point out, this low point on the graph gives us the only positive correlation of government regulations an effect with during the whole year. And this is that the deterioration begins a fortnight after the legal imposition of mask-wearing, consistent with the masking-up causing the deaths. I am inclined to think it coincidental, but since there are theoretical reasons for masks to increase respiratory problems and other pathologies, “further research is needed,” as they say in scientific papers. What is absolutely clear is that any correlation with masks is the opposite of that intended, that is “saving lives.” A policy whose result is the reverse of what you intended ought to be abandoned – unless what you intended was actually something else, like social control.
On the slow, smooth curve from August to October, the virus remains blissfully unaware of the return of children to school in September, the 10pm curfew and the return of students to prison university, at the start of October, and the initiation of the Tier system later that month.
In fact, once more the infection rate started to decline a few days before the tier system started. And although the data beyond that point is incomplete, it is pretty clear (and easily confirmed from the ONS stats) that another natural decline has occurred, unaffected by the tightening up of tiers and, more significantly, by the impositition of another lockdown in November. That brings us up to date. The lockdown has been replaced by yet another, harsher, tier system, and the infection rate continues to decline at its own pace, with no reference to any of these policies. The government truly is “controlling the virus” as effectively as King Cnut ruled the tide, only with the difference that the Dane pulled the stunt to demonstrate his non-divinity, whereas modern governments are riding roughshod over the data to pretend to omnipotence.
Incidentally, the mobility data also show that actual behaviour has as little correlation with outcomes as the lawmaking and hectoring does. As summer ended, people naturally began to travel less, yet infections were increasing regardless. Just before lockdown, there was brief peak of making the most of things, and an extremely half-hearted fall in movement after lockdown which began to fail as soon as it began. Neither disturbed the downward trend. Yet the government was quick to say that the lockdown had saved lives, despite the fact that it was a lockdown almost in name only, and that infections had been falling steadily for nearly a month beforehand, and did not increase their rate of decline.
The more one looks at this data, then, the more it is clear that all the pain we have been through because of the government “saving the NHS and saving lives” has made little or no difference to the effects of a Coronavirus running its natural course towards herd immunity. Since there is every indication that herd immunity, in most areas, has been all but reached (possibly last of all in my west-country soft spot), the risky and expensive roll-out of vaccines seems unlikely to change much either, apart from the power and wealth of the Technocrats.
On the other hand, the unprecedented human costs of government policy – as opposed to the human costs of the pandemic itself, not much different from two years ago, and less than the year 2000 – have been astronomical, and will continue to be so for decades to come. I can see no evidence to the contrary.
That seems to be the scientific conclusion. Why it has been allowed, or in fact forced, to happen is a political question. It is still not clear that we can exclude a deliberate agenda, given that sore thumb of the World Economic Forum’s Great Reset, which is a “deliberate agenda” scheduled for May. Likewise the UN’s linked Agenda 2030, in its very name a “deliberate agenda,” has in this very day’s news been made the priority for 2021 by the UN Director-General, as opposed to the more obvious one of sorting out the mess the WHO has made of the world’s economy.