We all know that the overall ONS testing stats, so useful for scaring the public, are pretty useless for knowing what’s going on. Apart from the questionable nature of the (predominantly PCR) tests themselves, which may be hiding a casedemic, they are subject to a varying number of tests being done (so at least half of the present increase in cases is due to the increasing number of tests), to testing being concentrated on hot-spots rather than a consistent sample population, and increasingly to their consisting of an unspecified mix of PCR, LFT and antibody tests.
But the website does enable one to select individual testing “pillars,” one of which is useful, and one of which would be useful if it told us more information.
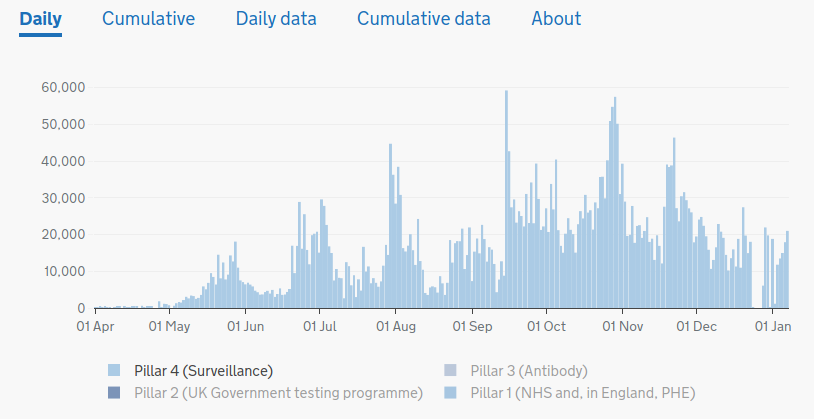
Pillar 4 is the government’s surveillance system, which appears to sample, in a decently scientific randomised manner, a steady 1100 people a day. Unfortunately, it uses an annoyingly unspecified mix of PCR and antibody testing. But at least it is useable, and it gives an interesting picture, at variance from the swill-bucket of the headline figures:

It shows not quite a random scatter, but it’s not that far off it. All one can really say is that something was happening in the summer (low level of IgG immunity? PCR casedemic? Both?) but that something new definitely happened towards the end of September, which was presumably the seasonal spike that folks like Ivor Cummins (and me!) predicted, but which the WHO’s non-seasonal model did not, except in terms of blaming the public for whatever they were doing at the time, which was nothing different from the summer.
But it is also clear that this “wave” peaked in early November, and has been steadily declining ever since. What we see now may be residual antibody presence, or a lowish level of positive PCRs (why on earth don’t they separate them??) but what it definitely isn’t is a viral epidemic increasingly out of control with unprecedented numbers of infections.
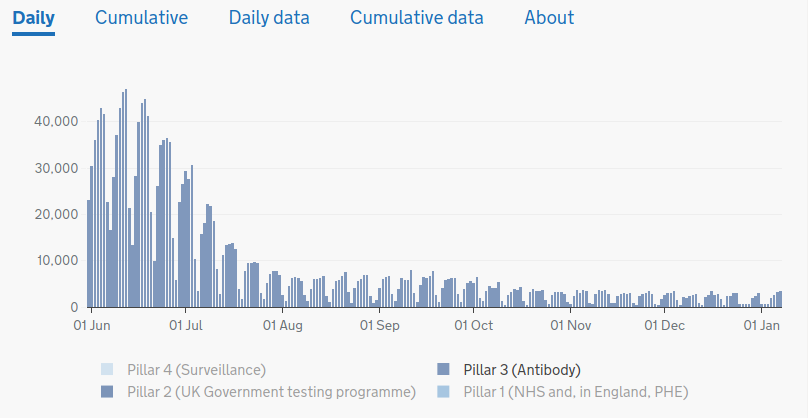
Pillar 3 is antibody testing. If we knew the ongoing rate of sampling, that would give crucial information, but once again there is insufficient data – we are nowhere told how many tests are being done, but only given positive results without a context. But if we were to assume the programme hasn’t simply lost its impetus, the chart’s meaning would be massive. Here it is:

As you probably know, IgG antibodies to coronaviruses begin to increase, like most viruses, after a couple of weeks post-infection. But they tend to fade after around 3 months (which HMG says indicates a loss of immunity, but doesn’t because T-cell immunity remains long term).
On this chart, then, we see a large surge of IgG presence in June, reflecting the spring epidemic (and probably an initial couple of weeks of ramping up the tests). The decline in this closely matches expectation, as maximum infections occurred 3 months earlier, in March. Then there is a small surge in September/October, again correlating to the onset of colder weather and a small seasonal resurgence of COVID. But from late September, antibodies begin to decline, and completely flatline thereafter until now.
The only two possible explanations are either that the NHS has got bored with antibody testing despite a crisis in COVID infections, and the whole chart is meaningless, or that it reflects reality. That reality would be that there is no COVID in the community whatsoever to produce an antibody response, the residual positives being due to a minority of people who have retained their IgG long-term.
In the latter case for Pillar 3, one would probably have to explain Pillar 4’s rather sporadic data as indicating nothing but a pure PCR casedemic superimposed on patchy antibody results. The false positives would be un-smooth simply because of the relatively low sample size of 1100. In other words, it too is compatible with the complete disappearance of SARS-CoV-2 at the present time.
This seems a radical conclusion, even to me. Given this government’s record, it’s intrinsically more likely that their world-beating antibody testing programme has just been sidelined along with its world-beating tracing apps, world-beating Moonshots and the modest, but correct, promise of supplying Vitamin D to the vulnerable. Adding such poor data to the overall test results would be scientifically irresponsible in itself.
And yet, and yet… the pattern Pillar 3 reveals is not only entirely consistent with the expectations of the traditional viral epidemiology that has been abandoned on all sides in 2020, but it is consistent with all the official PHE syndromic data for 2020, about which I wrote yesterday.
As ever, the choice is yours. Perhaps Pillars 3 and 4 are faulty, but they are at least relatively circumscribed enough to be interpreted, if the data is good. The PHE syndromic data is not only good – it is definitive of the situation in Britain over 2020.
On the other hand you may prefer to swallow the headline ONS data on cases, which is indisputably messy, uncontrolled and subject to a plethora of objections methodologically.
Somewhere in the middle is the situation in our hospitals, which if COVID really is present is about to risk the lives of the aged we are ostensibly trying to protect as plans are made to repeat last year’s catastrophic decision to discharge hospital patients into care homes.And if it’s not COVID, but other mis-diagnosed virus, that are filling the wards, then that policy would be just as destructive.
But I ventured an alternative explanation for the claimed bed-crisis in yesterday’s piece, linked at the top. And it does not involve COVID, and therefore ought not to involve all the cruel and unusual punishments being inflicted on young and old, and therefore does not need to have us all inoculated with incompletely tested vaccines twice a year for ever whilst retaining the restrictions on our lives and our economy.
You will agree, I hope, that this is at least a possibility that ought to be explored. But since instead the screws are being tightened ever tighter, it will be worth looking at what motives might make powerful people prefer that to normality. That will have to wait for the next post.

Now, another strand of evidence is the unexpectedly low positive rate of LFT tests, which was noted in the initial roll-out, but was again reported in the New Scientist on 23rd December regarding Birmingham University students in relation to the “more accurate” PFR test. This is definitionally true since the WHO diagnosis is entirely based on a positive PCR, but might equally be explained by the high false positive rate of PCRs as practised in real life:
It is not insignificant, though the sciency New Scientist seems unaware of it, that both figures are roughly equivalent to, or even below, the false positive rates of the respective methods. There is no clear evidence, therefore, that any students at Birmingham University had COVID, especially as they were, it seems, asymptomatic when screened.
Wouldn’t it be nice if somebody bothered to calibrate both methods against a viral culture gold standard instead of simply comparing un-validated tests against each other and mere assumptions of their accuracy. And after that, standardisation of the techniques would help. The article ends:
Well, Pollock is right, but much kinder than Prof Sir Muir Gray, the founder and former Director of the NHS’ screening service, who said in the BMJ the programme is a mess. But how typically unscientific is the government’s response. “The country’s leading scientists” evaluated it – but are our best scientists astronomers, psychologists or what? Don’t they have names? Can’t we read their evaluation?
No, of course not: one suspects the engineer and amateur computer programmer Ian Ferguson, or some crony, simply waved it through with the usual absence of peer-review because it achieves a few extra cases by delivering more tests for the buck.
CORRIGENDUM
I’ve just noticed that the ONS stats on “pillars” actually refers to numbers of tests, not numbers of positives. This may obviate the whole argument of the post, but it still reveals odd truths.
The first is that Pillar 4, surveillance data, is not as organised as it seems, but completely sporadic in sampling, thus rendering the data pretty useless. And pillar 3 only gives the pattern it does because of apparently equally disorganised sampling – lots of antibody tests done at first, and for some reason very few during the supposed “second wave.” Why?
As far as I can see, then, there is no way of extracting the positive results of the individual pillars from the morass of ONS data, though I’ll keep looking. This doesn’t alter the intriguing pattern of PHE data discussed in the previous post.