
As I anticipated, our Harvest Festival had a significant section on failure of harvests in poor countries and how we need to help, in this case focusing on Uganda – a country where, but for providential circumstances, I might have worked. I voiced my reservations about the anthropocentrism of harvest thanksgiving nowadays in my previous blog, and I won’t labour the point. What I will mention, though, is another near-universal theme in the kind of video we were shown – that it is the poor who are already feeling the brunt of climate change, witness the increasing droughts being experienced by farmers in Uganda.
I find myself asking, firstly, if there are actually increasing droughts (especially since other videos point to other “extreme events” like floods, cyclones, and fires as the penalty the developing world is paying for our sins). And secondly, I wonder how we would know that any such trend is due to anthropogenic climate change rather than to natural variation. After all, did we not all grow up with reports of recurrent droughts and famines in tropical nations – some of them, indeed, in the Bible? Oxfam, after all, was founded back in 1942 when the air was pure, apart from the cordite.
But it is easy to see why such claims are made, for the UNFCC, presumably regurgitating IPCC summaries for policymakers, says:
Climate change, which has started manifesting itself through increased frequency of extreme weather events, such as droughts, floods and landslides, is posing a serious threat to Uganda’s natural resources and to its social and economic development.
Searching for “drought trends in Uganda” produced this rather suspiciously wavy chart:
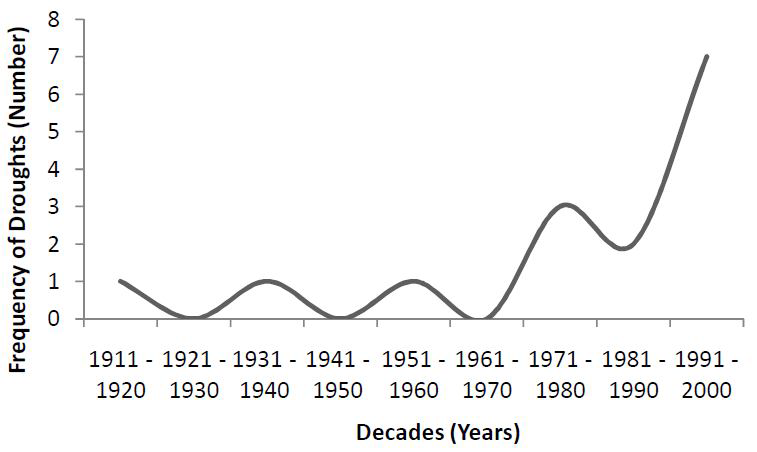
It was sourced to the authority of the Ugandan NAPA (adaptation plan) of 2007, where it looks rather less wavy – and considerably less data-rich:
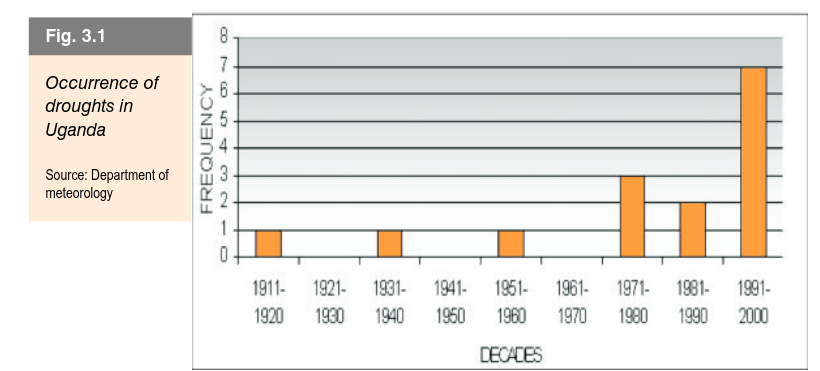
Here it is sourced to the authority of the “Department of Meteorology,” of which more below.
But the Uganda NAPA, overall, was produced as a (justifiable) response not to internal events, but to the modelling projections produced by international bodies, which we all know and love so well, and which its summary parrots verbatim:
Studies show that temperatures are likely to increase in Uganda by up to 1.5 °C in the next 20 years and by up to3.2°C by 2080s (IPCC 2014, Thorton et al. 2006). Additionally, if global greenhouse gas (GHG) emissions are not reduced, Uganda is more likely to see temperatures increases by up to 4.3°C by 2080s (Nakicenovic and Swart 2000, Goulden 2006, IPCC 2007). Changes in rainfall patterns, annual rainfall amounts and rainfall intensity are expected but there is less certainty (Lyon and DeWitt 2012). Seasonality of rainfall could also change in the future with highest percentage increase in rainfall during the current driest months (December, January and February). The current wet season from March to May might shift forwards in time or the September to November rains, may extend (NEMA 2010).
The familiar language of “might” and “could” dictates the agenda, rather than that of “is” or “has.”
The follow-up NAPA project report of 2016 has a rather more circumspect summary, without the diagram, though still based on the same modelled assumptions, but it does use them to interpret Uganda’s recent natural history:
Climate has varied in the past and is expected to continue to do so in the future. However, climate change will increase climate variability resulting in frequent and intense extreme weather and climate events such as droughts, floods, landslides and heat waves. The events of the past few years have clearly demonstrated the increased frequency and intensity and also the magnitude of the problem (climate change). Uganda experienced seven droughts in a period of ten years (1991 to 2000) as shown in Fig.3.1.
Note the verbal “mission creep” that now makes the deterioration a certainty, rather than a possibility. But wait a bit, for in the year 2008, in the light of the NAPA, LTS International, a funding organisation, produced a report which comments directly on the NAPA graph of historical drought trends to which I first alluded:
Great care should be taken when interpreting recent climate trends as climate change. There is insufficient information presented in the NAPA to allow judgement on the quality of the data, nor is the source revealed. Important questions include the criteria used to describe drought; the geographical extent affected and duration; and whether data are based on verbal reports or meteorological observation? Long time series rainfall data are lacking or contain gaps for many locations in Uganda and the graph could reflect this skewed availability of data or recall bias, if based on testimony. Dr Goulden found no clear change in the frequency of droughts up to 2004, but found that droughts occurred fairly regularly. Research has linked rainfall variability in East Africa to ENSO and sea surface temperature variations in the Indian and Atlantic oceans, with cycles of approx 2.3, 3.5 and 5 years, though there is very little published literature on recent trends in Uganda or East Africa. Neither are data showing increased rainfall variability convincing with NAPA graphs showing only 3 years of data – not enough to establish a trend, though this is stated as fact in the NAPA on page 22 (2nd para).
Climate Change in Uganda: Understanding the implications and appraising the response – LTS International report 2008
It is not that the LTS report doubts anthropogenic climate change. In fact its first two executive summary points more or less quote the NAPA’s own introduction, citing the IPCC’s Summary for Policymakers. But clearly somebody there wants to assess some evidence, for point 3 of their summary says:
The level of Lake Victoria is highly sensitive to changes in climate. However, recent claims that the drop in lake level is due to climate change should be viewed with scepticism. Approximately half of the drop in level between 2000 and 2006 can be explained by excess releases at the outflow of the lake made in order to meet power generation demands, whilst the other half appears to be due to climatic factors. It is not yet possible to conclude that climate change is affecting lake levels – Lake Victoria has a long history of high variability in lake levels in response to natural climate variability. Instead it appears that lake levels are returning to the lower levels experienced before the unusually high levels of the 1960s and 70s.
Now my following of the paper-trail shows that the predictions of increasing extreme weather events predominantly come either from the IPCC, or from the interpretation of rather weak evidence generated in the light of the IPCC predictions. But if one digs into the latest IPCC report itself, behind the stuff fed to politicians and press to the technical report of Working Group 1, you find that there is zero trend in extreme weather events worldwide over the past century, and other data shows an absolutely massive drop in deaths from them, including deaths from drought, over the same period.
So what about the actual situation for Uganda? Can we find any trends in the East African region from more complete data? If you look at one dataset you could argue that there is some upward trend:
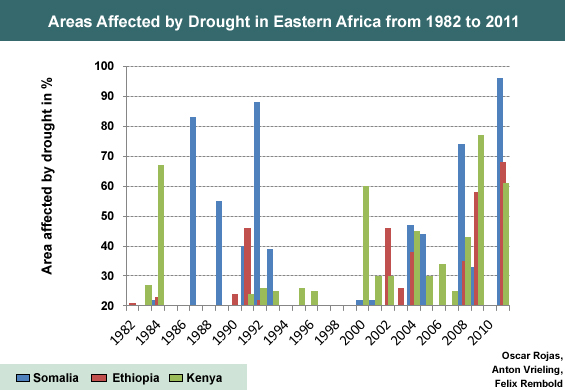
But this covers only the period from 1982, and it although it shows a recent spike in the three countries named, there are significant differences in the pattern across the region. Furthermore, even in this short time-span, all deep within the “climate change” period, there was almost a complete disappearance of drought in the 1990s from a higher frequency which, in Somalia at least, was similar to what it is now. In short, there is zero correlation with steadily increasing CO2 levels.
A study covering a longer period, that is to say the entire “anthropogenic climate change” century, is discussed here.
The bottom line is this chart:
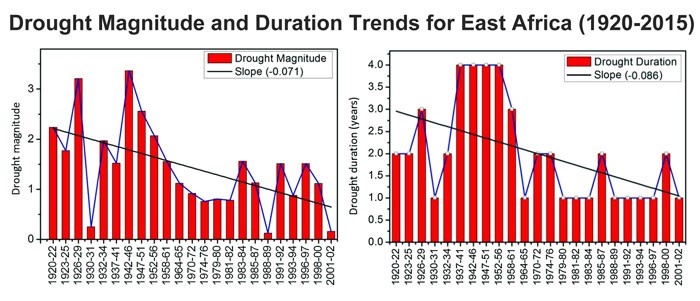
As you can see, both in duration and magnitude, East Africa has seen a significant decrease in droughts from much higher levels in the first half of the last century. In fact, any genuine increase seen after the period of the chart would only show a return to previous patterns. If, as is indeed the case, poor agriculturalists are struggling with drought in Uganda now, their government may well only attribute it to climate change because their ancestors, suffering far more frequent and serious droughts, didn’t survive to tell them that they’ve never had it so good.
We can’t, I think, explain the actual variation in weather patterns except to say that it bears no obvious correlation with human activity. But maybe we can attribute the greater survival to what humanity has learned about increasing crop yields using fossil-fuel produced fertilizers, improving infrastructure from fossil-fuel generated electricity and fossil-fuel-powered transport both to increase prosperity and to import food when it is threatened, and of course the concern and awareness of Christians in the fossil-fuelled west who can afford to make professional videos and to give generously to useful projects, at least until climate alarmism collapses their own economies.
And we mustn’t forget, of course, the greater crop viability seen worldwide because of more CO2 in the atmosphere!
Hi Jon,
This presentation is interesting; my view is two-fold:
1. I do not support attempts to make a linear correlation between climatic events such as floods, drought, fires, and human activity as presented in the press, and
2. I think that levels of CO2 (and other Greenhouse gases) have been increasing, and we should focus research on a better understanding of the impact atmospheric chemistry has on the global cycles.
For example, the carbon cycle provides a better understanding of CO2 levels on various activities, such as agricultural output, along with other factors such as better farming practices.
While our understanding of the details of Greehouse gases on climate (and other factors) is not sufficient to allow some of the claims made in public utterances, I think the fact of Greenhouse phenomena is beyond dispute.
Hi GD
My position is that whilst CO2 is rising in the atmosphere, in a linear fashion, levels do not correlate at all well with human emissions, and neither is it at all clear what is the link with average temperatures, let alone extreme weather.
Satellite data suggest there has been no upward trend in the lower atmosphere (and a complete absence of the tropical tropospheric hotspot predicted by Greenhouse theory) for around a decade, and figures on September Arctic Sea extent (another poster child of warming) show no trend either way for 17 years. Central England average temperature has remained steady for 20 years, despite what is blamed on climate change here.
It looks from the data as if there has been a century and a half of emergence from the Little Ice Age, a temperature peak in the 1930s (a period excluded from most mainstream discussion), and another peak in the recent past which, perhaps, is levelling off. Yet emissions (despite political decisions and massive spending) have continued to rise mainly from the developing world, if you don’t count the massive release of methane from blowing up Nordstream.
There has been a good deal of work that suggests that the “Greenhouse Effect” of CO2 is already saturated. The problem is that rather than focusing, as you rightly suggest, on further investigation of atmospheric chemistry (and physics), a single phenomenon has become the entire basis for research money and world political and economic policy.
Hi Jon,
I recall a comment I made when I gave a lecture in a symposium held at the regional campus of La Trobe University (more than 15 yrs ago) to a question put to me on this topic. I said that the area had become politicized (and how!!!) and we would end up with the worst of all possible outcomes.
I wish I was wrong. I had considered atmospheric chemistry and Greenhouse gases during those days, and your comments have spurred me to revisit this area, and to take a look at how measurements are made. I had become alarmed on reading a physics paper that compared the impact of gases such as methane, hydrogen, and various hydrocarbons on the atmosphere (many times more potent than CO2).
I had provided comments to an agency that passed information to numerous newspapers, but few took these to provide an informative article for the public.
I will revisit the topic during the week.
GD
You were certainly prophetic about the politicisation (though there is some evidence the whole thing started as a political project to engineer geopolitical change through weaponising the climate – a whole other paper trail to follow!).
One of the many glitches is that by far the most potent, because abundant, greenhouse gas is water vapour, and the uncertainties regarding how, if at all, that amplifies or damps everything else are still apparent, so that it usually gets left out of the models, I believe. That’s related to the effect of clouds, both in terms of how climate change affects cloud cover, and what that does to the climate in turn.
But it’s always worth remembering that life on earth has flourished for 3 billion years, with many cosmic and geological upheavals, often at far greater CO2 levels, and that even in Jesus’s time the world was significantly warmer than it is now – resulting in the ability to feed the Roman Empire with abundant grain… bringing us back to Ugandan famines!
GD
This paper might be of interest?
Thanks Jon; I am downloading a few papers that deal with methods and accuracy of GHG concentrations in the atmosphere. From the abstracts so far, the overwhelming impression is “Carbon dioxide, methane, nitrous oxide, and other greenhouse gases increased over the course of the 20th century due to human activities. The human-caused increases in these gases are the primary forcing that accounts for much of the global warming of the past fifty years, with carbon dioxide being the most important single radiative forcing agent.
GD
I’m assuming you’re aware of the publication bias on climate work since the 1990s. It’s very difficult to get anything published that is not in line with IPCC’s position.
A recent exception is Spencer and Christy’s paper on the vexed question of the climate’s effective sensitivity to CO2.
Jon,
I am looking at how GHG are measured and accuracy/reproducibility. I am also looking at a few papers that enable me to gain insights at modelling. If you wish to view these papers I can email them to you once I have finished with them (send me you email address).
So far, I am satisfied that measurements are reasonable within the context of sampling constraints and historical data (the older stuff needs scrutiny, but I do not have that much time).
A paper that traces model development leaves me unsatisfied – it is qualitative and descriptive, but the authors admit as much. The paper you provided is good as they reproduce the IR spectra and compare it to measured; this however is the atmosphere. Papers either deal with a specific matter, or try to link all factors (concentrations, ocean, atmosphere, land) and are less robust.
I continue to read….
Thanks. You’ll find me at contact at jongarvey dot co dot uk.
I cannot find this contact. An email address would work.
I have emails from past discussions – is this address ok?